Plant-Pollinator Networks
Pollination is the basis or major facilitator of plant reproduction for
87.5% of global flowering plant species,
making plant-pollinator networks
critically important to both the basic maintenance of terrestrial biodiversity AND agricultural output. Plant-pollinator networks are an example of what are called
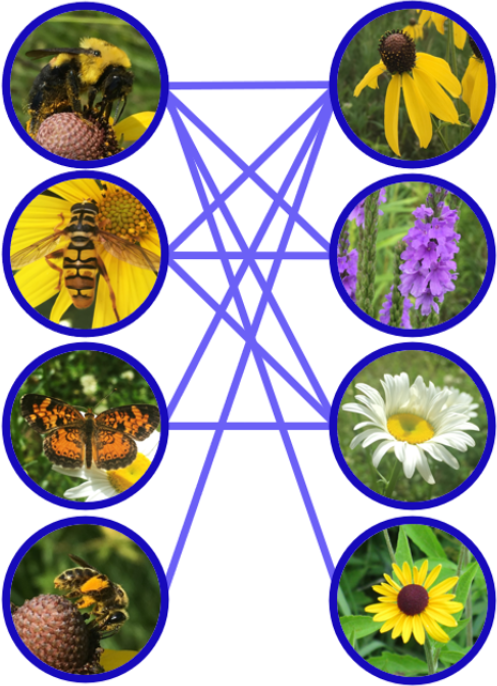
bipartite networks gven the two classes of nodes, plants and pollinators (Fig 1).
Unfortunately, the integrity of these networks are threatened due to widespread species and habitat loss. Consequently, any movement towards a sustainable
future must include a better understanding of how these networks function.
My most recent work involves, organismal timing or phenology in the context of these networks. For example, organismal phenology for pollinators
describes what time of year they are active and foraging. For plants it involves when plants flower and produce floral rewards.
An important driver of the topology of plant-pollinator networks is the diet breadth of the pollinators. By merging two benchmark theories of diet breadth
in ecology (MacArthur & Pianka, 1966) and (Waser et al., 1996), we developed and tested our hypothesis regarding how phenology can drive foragers’ diet breadth.
This hypothesis is described below and visually depicted in Fig 2.
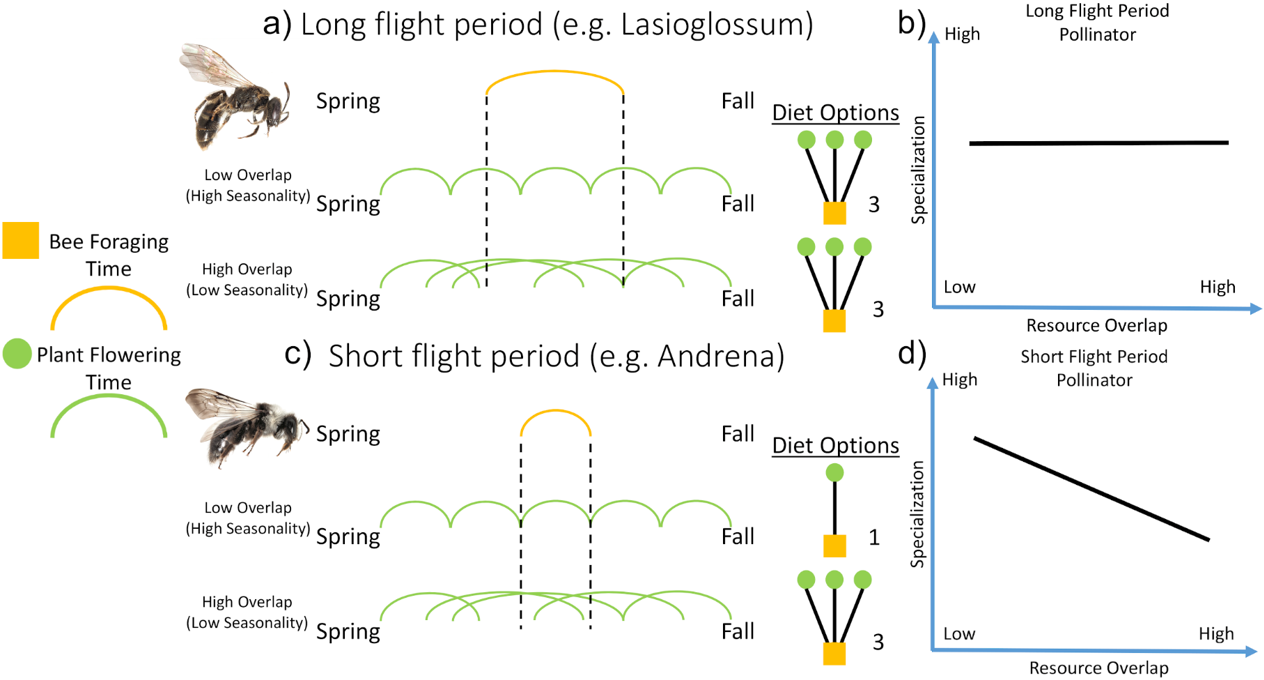
Our hypothesis centered on how the phenology of different resources (flowering plants) related to each other and the foraging animals (pollinators) that consumed them.
Specifically, we hypothesized that the degree of temporal overlap amongst different resources will have a significant effect on the diet breadth of pollinators
with a short foraging period but little to no effect on pollinators with longer foraging periods. Please see Fig 2 for a graphical depiction of our hypothesis.
We tested our hypothesis with a multifaceted approach:
1) Mathematical Modeling: I modified an adaptive foraging model to incorporate organismal in a simple, computationally efficient manner that could
scale with various community sizes in our simulations. With this, I could directly control both plant phenological overlap and pollinator flight period.
2) Intercontinental Data set: Model results were corroborated with a large data set of plant phenology and bee pollen load data. All data was
gathered from either the United Kingdom or Michigan, USA. The UK has a flowering phenology profile with high overlap while MI has comparatively little
flowering overlap. All pollen data was collected from two bee genera, Lasioglossum and Andrena. Lasioglossum has a long flight period while Andrena has
comparatively short flight period. This gives us the necessary elements to test each aspect of our hypothesis.
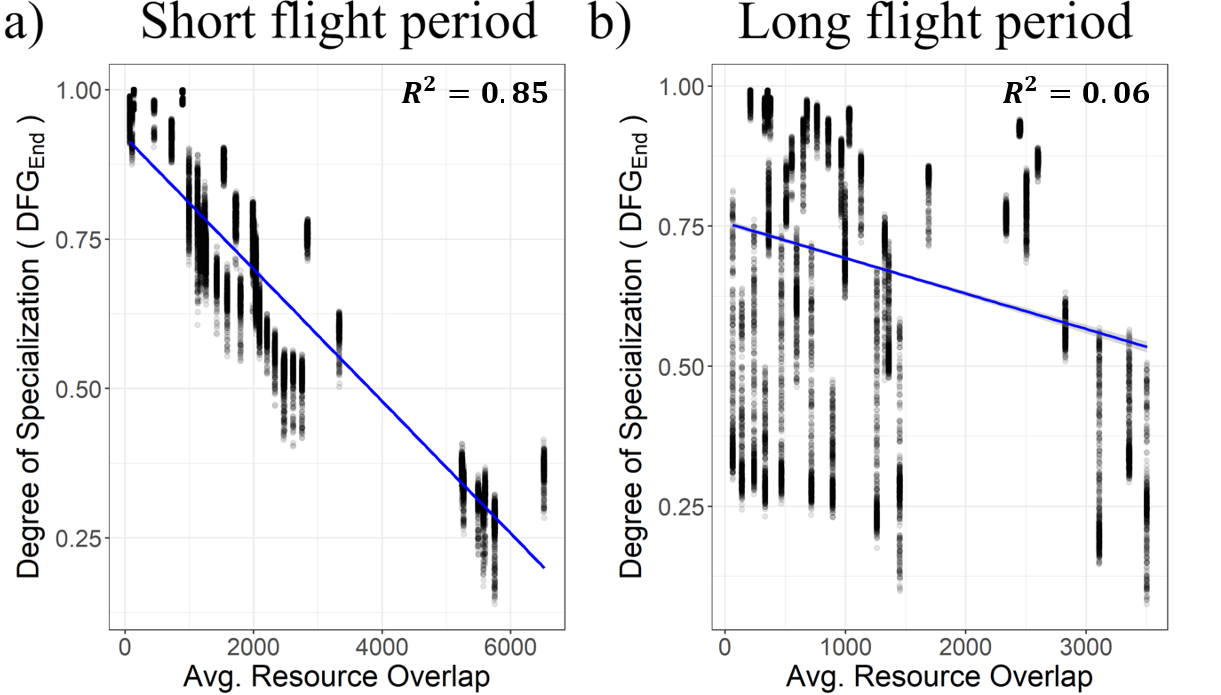
Modeling results matched our hypothesis well. In the example shown in Fig 3, we short flight period bees experiencing significant change in diet breadth due to temporal resource overlap. As a demonstration, we see that a simple linear model of Average Resource Overlap explains 85% of the variance of diet breadth (measued as specialization with our DFG metric, see below). In contrast, simulated long flight period bees see no effect of resource overlap on its diet breadth.
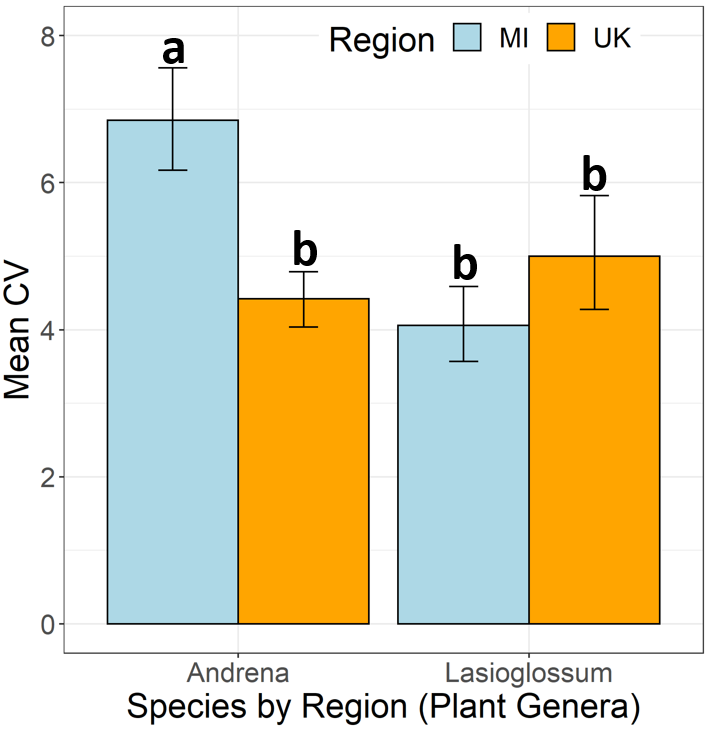
Analyzing our intercontinental data set reveals corroborating results (Fig 4). Results are measured using the Coeff of Variation metrics where higher values
indicate more specialized diets and lower values indicate more generalized diets. The short flight bee genus (Andrena) see a significantly higher specialization
in MI compared to the UK. On the other hand, the long flight period bee genus (Lasioglossum) sees no significant differences between the two regions.
In future work, we hope to expand this analysis to investigate the effects of climate change on organismal phenology and network robustness.
This research is published in Ecology Letters and can also be seen on my Research Gate page.